


To create a Gantt Chart in Excel:
1) Launch Excel and click "Make Calendar or Schedule" from the WinCalendar menu in Excel.
2) Select ...
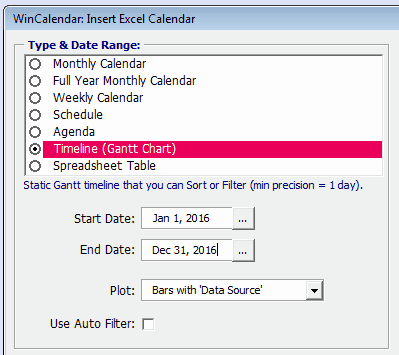
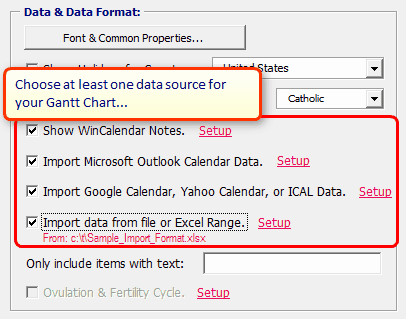
3) ...in the same dialog, select import data to import. Note the Gantt Charts are created as static regular Excel files. Data must come from one of the below Import sources...
4) Press OK to generate the Gantt.
Important Notes:
| • | A Pro License is required for Gantt Charts (otherwise WinCalendar will only generate some items for Demo purposes). |
| • | If creating from Excel data simply choose the Import data from file or Excel Range option and click Setup to setup. |
| • | Gantt Charts have a minimum precision of 1 day. Therefore a item that is say 1 hour in duration will plot same as a 1 day duration item |
| • | All Gantt Charts are created as static regular Excel files (without any formulas, macros or automation). Editing dates in the resulting Gantt Table will not update the Chart. |